
01 October 2019
Pen
Introduction
Pen is a vector design application that combines features from two types of application, namely a drawing canvas for creating and manipulating Bezier curves, and a code editor for writing and editing SVG markup. Pen thus lets users work with two representations of the artwork they are creating, and live-syncs these two representations. The ultimate aim of this approach is to simplify the process of creating SVG artwork for the web. Pen is currently available in a prototype version. This case study reflects on the development process so far.
Implementing the business logic needed to facilitate vector editing in the first place took time to get right. However, the most challenging aspects of developing Pen were related to higher-level concerns, such as managing state, and the way data flows through the application. For this reason, most of this case study focuses on these more “architectural” aspects.
That high-level design questions played such a large role in the development of Pen is partly a consequence of an initial decision I made to work from scratch. I built Pen without any frameworks since one of my personal aims was to get a better grip on the problems frameworks are trying to solve, and to experiment with strategies for solving them. So I decided to work in vanilla JavaScript and use lower-level libraries only (most notably, CodeMirror as a code editor component, and Bezier.js to simplify working with the mathematics of vector shapes), rather than throw React or some other high-level framework at the task.
Of course, I was very willing to benefit from the ideas others had developed, and this case study will reference these ideas where I used them. In particular, the design patterns described in the Gang of Four book have turned out to be indispensable.
Section 1 discusses the general ideas that motivated me to start this project, and gives a rough overview of the feature set supported by the initial version of Pen. Section 2 discusses two of the main design problems Pen had to solve: structuring documents, and handling document changes. This leads me to introduce two of the core concepts on which Pen builds: scene graphs, and finite state machines. Section 3 presents the overall structure of the Pen application, and the way the two core concepts fit into this bigger picture. We discuss the main application layers, their interfaces, and the app loop that draws everything together. Section 4 discusses performance, giving some insight on how I optimized a sluggish prototype to make it more performant.
Background
This section discusses the general ideas and inspirations that motivated me to develop Pen.
Use cases
Nowadays, many websites and web applications rely on SVG, due to its pretty unique blend of attractive features – SVGs tends to be small in terms of file size, they provide a crisp look at all screen resolutions, they are easy to edit, and provide a good target against which to write animation code. When I started developing Pen, I had two primary use cases in mind:
- Aid the Learning Process. Designers who want to make the most out of SVG need to acquire a working knowledge of its markup language. While using only markup as a tool for creating vector images from scratch is tedious, to say the least, having a good grasp of the way SVG works is indispensable if you want to put it on the web, particularly when working with animations. This can be a challenge, however, as parts of SVG markup may appear “pretty indecipherable … a ton of numbers and letters smashed together into a long string.” Pen aims to be a learning aid in this context, as it allows to play with markup and its visual rendering side by side.
- Enhance SVG Workflows. SVGs are typically created in a graphics editor, and prepared for use on the web in a code editor. Typically, this involves styling the artwork via CSS. This can create a gap between the designer’s task of creating visuals, and the developer’s task of site integration (even if designer and developer happen to be the same person). Pen aims to help bridge that gap.
So Pen aims to be both a learning tool, and help with workflows for putting SVG on the web.
Main idea
As mentioned above, people work with SVG from two angles, using design tools (like Sketch or Illustrator), and developer tools (like a code editor, or a build tool). In a design tool, the SVG language takes the back-seat and is hidden from the user’s view. A code editor, on the other hand, typically offers no dedicated tools for working with graphics-oriented markup. To inspect the result of styles being applied to an SVG, e.g., we typically need a web browser. For this reason, I felt that a tool was needed that speaks both languages, graphics and markup.
The idea, then, is to treat markup as a first-class citizen, on a par with graphical output. Pen allows users to directly manipulate their artwork using markup, and conversely, makes the markup representation of drawing actions immediately visible. Here is what this looks like in practice:
 Pen drawing canvas (left) and markup editor (right).
As the screen capture shows, the distinguishing feature of Pen is that the shapes on the drawing canvas and the elements in the markup editor live-sync. The user may thus, e.g., edit the stroke or fill of a shape in markup, and have the change immediately reflected on the drawing canvas.
Inspirations
A major inspiration for the approach taken by Pen was Framer, a design tool that in its “Classic” incarnation, made some waves in the design community a couple of years ago, boasting a side-by-side representation of JavaScript code (CoffeeScript, to be precise) and an interactive prototype generated by that code:
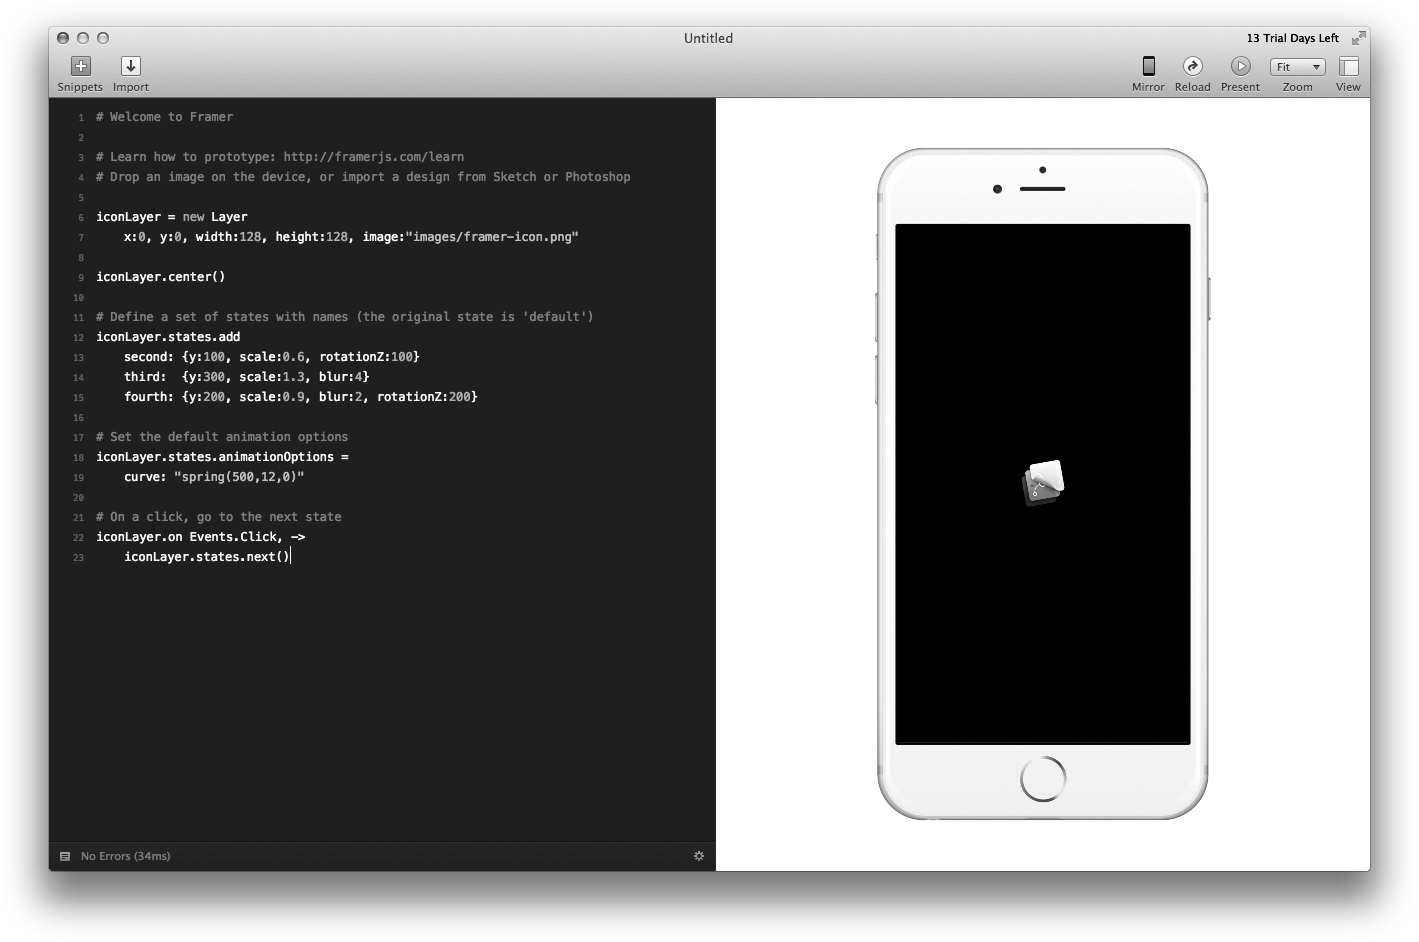 Framer Classic interface with layer pane (to the left), code pane (in the middle), and prototype pane.
Another inspiration were the developer tools offered by modern browsers, that have come a long way since “View Source”. Modern DevTools offer a myriad ways of peaking “under the hood” and interacting with websites or web applications from a developer’s perspective. In a similar manner, Pen aims to allow designers to peak “under the hood” of the artwork they produce.
Features
Here is a rough overview of the feature set I initially set out to support with the Pen project.
From a user perspective, a design tool like Pen at the very least should provide:
- a drawing mode to create and edit shapes on the canvas
- a select mode to select and transform shapes, e.g., by rotating them
- group/ungroup operations to hierarchically organize shapes
Since, as explained above, Pen focuses on the relationship between markup and its visual output, we will also have to provide:
- a code editor that represents our artwork as SVG markup
- two-way live-sync between drawing canvas and markup editor
In addition, in a modern in-browser application users will expect to find a number of features that are related to data persistence:
- CRUD: commit documents to storage, retrieve, update and delete them
- auto-save: persist document changes to storage without user intervention
- undo: revert to previous states of the current editing session
Design Problems
This section discusses two of the main design problems faced by an application like Pen – structuring documents, and handling document changes –, and outlines the solutions I used to get a grip on them.
Document structure
Editors are documented-oriented, so choosing the right data structure for this purpose is consequential for many aspects of our application. In a vector application, documents represent visual shapes, the way they are laid out in two-dimensional space, and color information such as stroke and fill, among others.
The most common data structure used to represent a document in vector-based applications is the scene graph. Scene graphs are tree-like data structures that model relationships between domain objects. Its leaf nodes are made up by mathematically defined shapes. For vector drawing applications, Bezier curves are the dominant paradigm in this regard. A Bezier curve is specified by a number of anchor and handle points that, taken together, determine a parametrized curve. Such curves may be composed to form Bezier splines, which are continuously drawn “poly-curves” consisting of a number of curve segments. In SVG, a path element represents a number of such spines.
A major advantage of the scene graph data structure is that it imposes hierarchical structure on a drawing. The user of a graphics application naturally sees their artwork as composed of various subparts, which may have parts of their own, and so on.
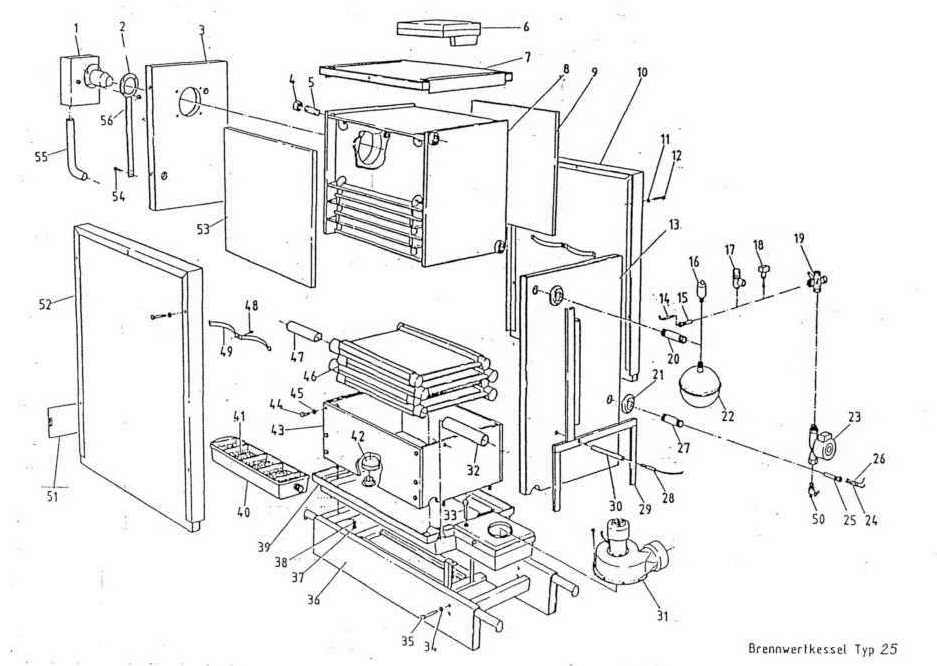 Drawing of a boiler with various parts.
Scene graphs allow us to capture these hierarchical relationships in a natural way, via the parent-child relation between tree nodes. This has a direct benefit, since operations that apply to individual parts may now just as easily be applied to wholes comprised of several parts (in Gang of Four terminology, this is called the Composite pattern). E.g., we often wish to scale or rotate several items that belong together at once. Scene graphs allow to implement this easily and efficiently by grouping the individual items first, and applying the transformation to the group rather than to each individual item.
Scene graphs form the core of the data model in Pen, just as in many other vector applications, and naturally so because SVG, our target format, is actually a scene graph description language. This raises a question though: given that we are working with SVG, shouldn’t we take advantage of the fact that the browser natively supports SVG, and use an SVG DOM structure as our internal document representation?
This may seem useful at first sight, since SVG natively supports Bezier curves, groups, transforms, and a host of other useful features. Not taking advantage of this means having to build them ourselves, which at times feels a bit like reinventing the wheel.
However, there are also a number of arguments in favour of strictly separating the internal document representation from the view layer and its particular rendering format.
For once, scene graph and SVG DOM have different responsibilities. The scene graph models our document, and all of our business logic is tied up with it. The view, on the other hand, is responsible for display and user interaction. Separation of concerns then suggests to isolate both aspects as clearly as possible. More in particular, developers have long felt that mixing domain concepts (such as drawing, shape, group etc) with other functions of a software system makes the domain logic hard or even impossible to understand. Finally, and more concretely, our interface contains not one, but two representations of our document: a markup editor and a drawing canvas. While our document is drawn on the canvas using a scene graph (the SVG DOM), it is represented in the markup in textual form. It seems advisable, then, to settle on an internal representation that is independent of both these representations, and from which both these representations can be derived.
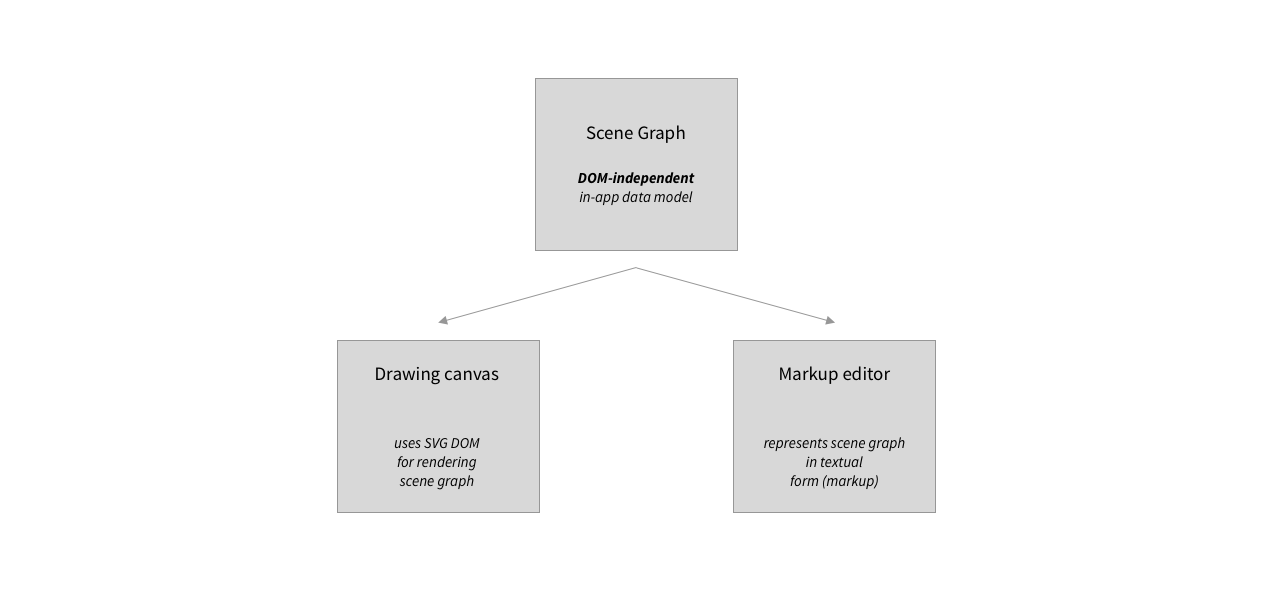 App-internal scene graph, and representations displayed to user.
On balance, constructing our own, DOM-independent scene graph rather than relying on the SVG DOM seems advisable so as to be able to build a well-structured application, and that is the route I went with Pen.
Document changes
The whole point of an editor of any kind is to make documents dynamic at run-time: users should be able to not just view, but also change documents. From the perspective of our application, changes originate with user events with a particular content. The challenge that arises here is that the interpretation of a particular user-event is highly context-dependent. Consider a user event characterized by the following parameters:
1
{ type: mousemove, x: 130, y: 140 }
This represents a mousemove event that was fired at the canvas position (130, 140). How should the internal representation of our document change in response to such an event? The answer is, of course, that it is not clear at all. It all depends on context. Perhaps the mousemove event was part of a drawing gesture? It could also be that the user was in the process of focusing a particular shape by hovering over it. Or perhaps she was rotating a shape?


To address this issue, our application must disambiguate user events in some way. One strategy available to JavaScript programmers to go about this is to use nested callbacks. We register a handler for mousedown events which, when triggered, registers two more event listeners: the first to handle the actual rotation on mousemove events, the second to deregister the first on mouseup events. Roughly speaking, here is what that would look like in code:
1
2
3
4
5
6
7
8
9
10
11
const rotate = (event) => {
  // code to handle rotation goes here
};

corner.addEventListener('mousedown', (event) => {
  canvas.addEventListener('mousemove', rotate);

  canvas.addEventListener('mouseup', (event) => {
    canvas.removeEventListener('mousemove', rotate);
  });
});
To disambiguate between various types of user interactions, one registers a number of nested event listeners of the above kind, each geared to handling one type of interaction.
While this is an efficient technique for simple scripts, it also has a number of drawbacks. As their number and complexity grows, tracing nested callbacks becomes mentally taxing to say the least. Nested callbacks also make it quite difficult to establish a separation of concerns between view layer and data model, resulting in code that is difficult to read. Finally, nested callbacks can be difficult to reconcile with another strategy that is important for perspicuous event management in the browser environment: event delegation (notice how we had to attach the event listener to a corner object in the above code – it’s hard to avoid this!). All of which is to say that nested callbacks do not scale well to applications that have to handle many, and comparatively complex interactions.
Finite state machines
The above suggests that we need a state managemente solution capable of disambiguating events in a more explicit way. The solution adopted by Pen is to use a finite state machine that transitions between states based on inputs that are derived from user events.
Finite state machines are about the most basic non-trivial model of computation. In the simplest case, such a machine consists of a set of states, and a labeled transition relation. This relation captures possible state changes of the machine as it receives inputs. A machine of this kind is called a finite state automaton. Here, we are mostly interested in a slighly more general machine model, the finite state transducer. Finite state transducers are characterized by the fact that, given a state and an input, they also produce an output, besides transitioning to a new state.
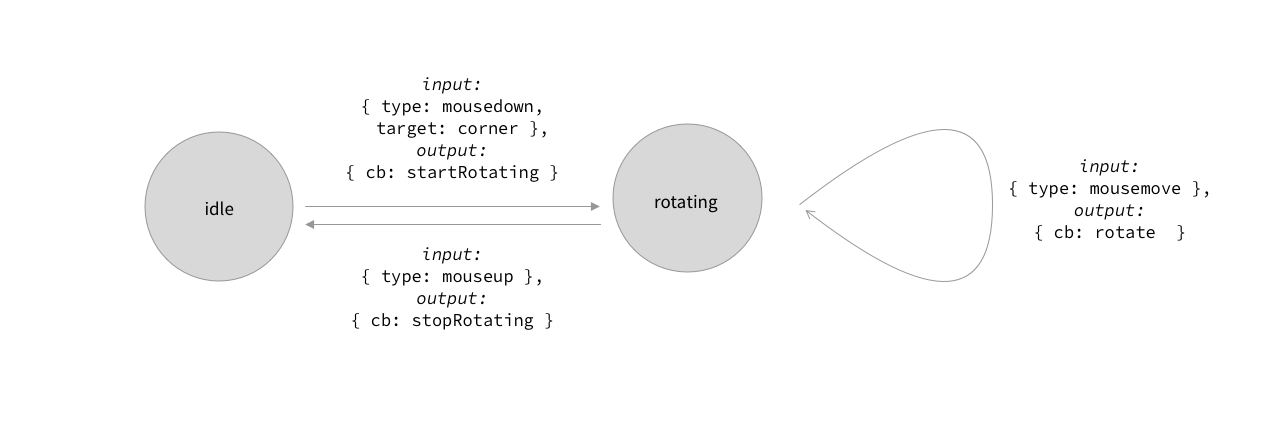
An example of such a machine is shown below – geared towards the problem we just discussed. Machine states are shown as circles, and arrowed lines correspond to state transitions. Each transition is labeled with an input and an output.
 Representation of rotating gesture as part of finite state machine.
Here is how this helps in the context of our design problem. The internal state of the machine captures the context we need to make sense of user behaviour in our application. Suppose the machine is in the idle state. The user presses the mouse button over one of the corners of a shape, i.e., a mousedown event with a target of corner. This makes the machine transition to a different state rotating. In this state, mousemove events are accepted, until the user lifts the mouse button, which makes the machine transition back to the idle state.
As shown in the drawing, each transition is accompanied by an output, which is simply yet another string. This string is the name of a callback function, which is triggered by our application. The callback mutates our internal document representation, rotating the selected shape appropriately.
The difference between this approach and the “nested callback” approach discussed above is that the machine effectively stores the context necessary for interpreting user actions. This helps keep event listeners flat, and delegate all events to the mount point of our drawing canvas. I found this approach to greatly simplify the event-handling code in Pen.
It also has additional benefits. In terms of application structure, the finite state machine will act as a gatekeeper that sits between user events and internal document representation: the only way of changing the scene graph is through an update (callback) triggered by a state transition of our finite state transducer. This makes the separation between view layer code and business code quite rigid, and thus easier to reason about. In addition, the execution trace of the finite state machine segments the way data flows through our application very nicely into a series of discrete steps, which helped a great deal with implementing features such as undo/redo, and auto-save.
Application Structure
In the previous section, we discussed two important building blocks for our app, scene graphs, and finite state machines. In this section, I will show how these building blocks fit into the larger picture of a complete “blueprint” for the Pen app. The application structure is inspired by Alistair Cockburn’s hexagonal architecture, and two well-known design patterns from the Gang of Four book.
Layers
The high-level design on which Pen is based follows the model of Alistair Cockburn’s “hexagonal architecture” (also known as the “ports and adapters pattern”). The original intent of this pattern was to avoid an “entanglement between the business logic and the interaction with external entities”, where an “external entity” could be either the user interface or a database, or another service hooked up with the application.
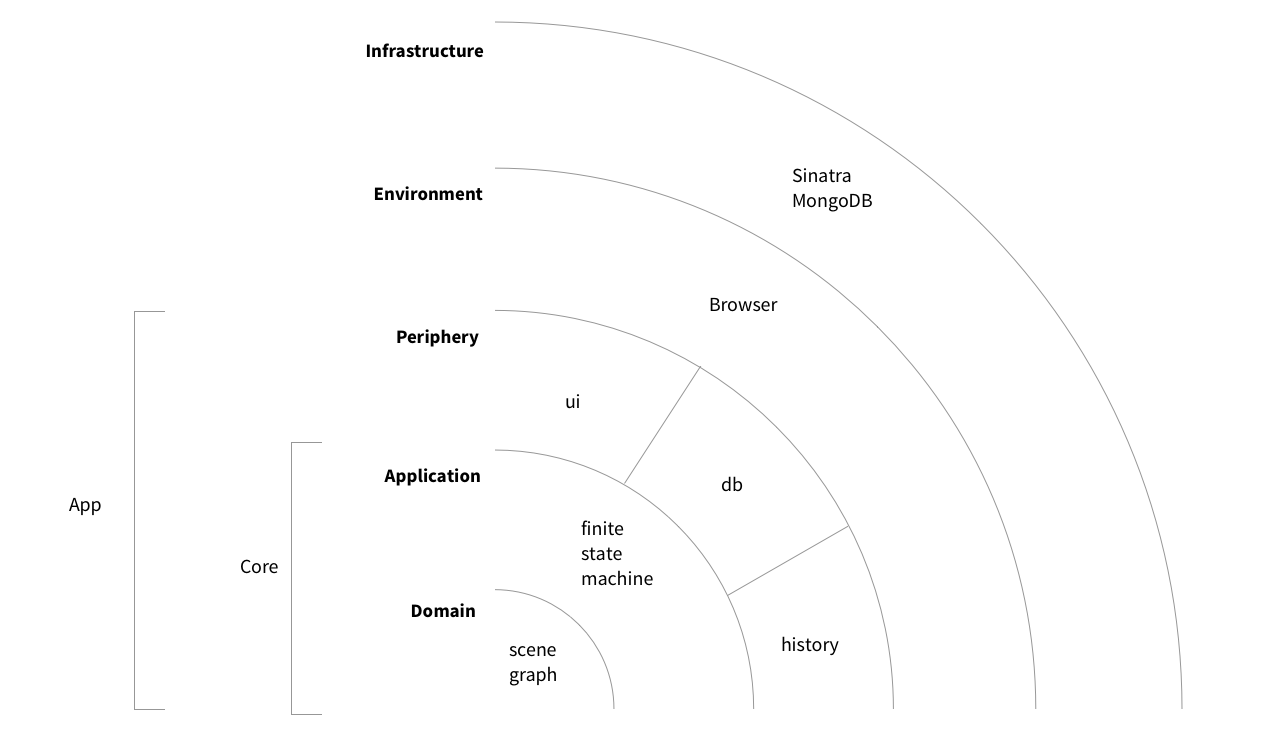
The overall approach I took is captured by an onion diagram with nested layers:
 Onion layers.
The basic idea here is that ignorance is bliss: inner and outer layers of the onion know as little as possible about each other, and interact via interfaces that are as narrowly construed as possible. The onion structure thus facilitates a strong isolation of its individual layers, which gives us a tight control over the way data flows through our application. But before going into that, let’s get an overview of the individual onion layers, and the role they play in Pen.
Starting at the outside, our app makes use of a infrastructure, a Sinatra/MongoDB backend, for global persistence. This choice was mainly motivated by the fact that the data we need to store is, as should have become clear by now, strongly document-oriented. This makes a document-oriented database like MongoDB a natural choice over, say, a relational database. I have chosen Sinatra mostly because our backend is simple: working with a larger framework would be overkill.
Next, the environment is constituted by the run-time for our application. In our use case, we work in the browser environment. This is the place where user events that are processed by the app originate. The app also changes the environment so as to make sure that the user’s view on the app is coherent with its internal state. In addition, to access its infrastructure, the app will have to go through the environment as well (this is why the infrastructure is wrapped around the environment in our diagrammatic representation). All of this happens, in our case, via browser APIs.
Pen uses the following browser APIs:
- All state changes in Pen ultimately originate in
Eventobjects.- The
Documentinterface is used to mutate the DOM tree in line with the application’s needs.- The
FetchAPI allows us to talk to the database via our backend server- The
Historyinterface is used as a vehicle for implementing undo/redo operations.requestAnimationFrameis used to synchronize the app cycle with the rendering cycle of the browser.
Jump now to the innermost onion layer, the domain. It holds the scene graph we discussed above. The domain is thus responsible for maintaining the document in its current editing state. As discussed above, we use a single tree object to do so: the scene graph. Within the domain, the scene graph is encapsulated with the business logic that operates on it.
It’s worth pointing out at this point that the Pen scene graph is implemented as a mutable data structure. This goes slightly against the grain of trends towards immutability that play an important role in the React/Redux ecosystem. Immutability in the context of a Web app has been claimed to enable sophisticated change detection techniques to be implemented simply and cheaply. As we will show below, Pen is still able to use functional programming ideas like structual sharing to optimize the procesing of state changes. At the same time, working with mutable state does have its upsides: we gain the advantage of bundling the data that makes up our domain state with the methods operating on that data (encapsulation). Our scene graphs are composed of nodes of a number of different types (
Canvas,Group,Shape,Spline,Segment,Anchoretc) that are hierarchically organized (inheritance). I found it very intuitive to have a class hierarchy (or rather, since we are working in JavaScript, a prototype chain) at my disposal that implements these various types.
Wrapped around the domain is the application layer. Despite the name, this is not the actual app, but simply another layer of the app. Together, the domain and the application make up the app core, as opposed to its periphery (discussed below). The most significant aspect of the application layer is the finite state machine we discussed earlier. With its help, the application layer controls any attempt to access the domain from the outside, as well as the way changes to the scene graph (state tree) are propagated to the outside.
Finally, the periphery consists of a number of “devices” that are attached to the application core. These devices serve as the link between the app’s core (see above) and its environment (see below). The periphery has two tasks. First, it binds external events, converts them to commands that the application understands, and sends these commands to the application layer. Second, the periphery receives information about state changes from the application layer, and updates the environment state using browser APIs, in response to these changes. Both aspects are discussed in more detail next.
As is apparent from the drawing, we make use of three types of such peripheral “devices”: a ui device handles user events, adb device is responsible for talking to the database backend, and a history device is responsible for dealing with session persistence. This means that, from a high-level perspective, user interface and persistence layers of our application are handled in a symmetrical manner – this is one of the key ingredients of the original hexagonal architecture model. Quoting Alistair Cockburn, the idea is to “allow an application to equally be driven by users, programs, automated test or batch scripts, and to be developed and tested in isolation from its eventual run-time devices and databases”. In essence, the peripheral and infrastructure layers of our onion are swappable without affecting the core.
Interfaces
The onion model provides a solid backbone for our app, helping us ensure that the components of our app “know” little about each other. In particular, it isolates business logic and user interface from each other, with the application layer serving as a gatekeeper between the two. This has two aspects: the core (comprised of domain and application layer) knows very little about the periphery, and the periphery knows very little about the core.
But they still have to know a little bit about each other. The periphery needs to pass information about events that happened in the environment to the core. And the periphery needs to learn about state changes that happened in the domain layer. To establish appropriate interfaces for these tasks, we use two well-known “Gang of Four” patterns: Command and Observer.
Let’s first talk about Command and the way it facilitates passing information into the core without breaking the isolation between layers. Command is “a behavioural design pattern in which an object is used to encapsulate all information needed to perform an action (…) at a later time”. In our case,
- the action to be performed at a later time is the update that happens inside the domain layer of our app and mutates the scene graph, and
- the information needed concerns the parameters of an event that happens at the periphery.
Here is how that is useful. Suppose a DOM event happens in the environment, and is dispatched to our app. For the sake of concreteness, let us assume it is a
mousemoveevent that is part of a rotation gesture. Themousemoveevent arrives at the periphery, and is picked up by a handler. Now the peripheral device itself does not (and should not) know how to interpret the event: it has no knowledge of the internal state of our app, and in particular, it has no concept of what it means to rotate a shape. The solution is to have the peripheral device convert the event into a command object, which may be passed to the application layer. This command object shall encapsulate “all information needed”, and the application layer will know how to deal with it “at a later time”, i.e., once the command object is processed by an app-internal update. It will look something like this:
1
2
3
4
5
6
{
  target: event.target.dataset.type,
  key: event.target.dataset.key,
  x: this.coordinates(event).x,
  y: this.coordinates(event).y
}
This command carries information about the type of the DOM element that was targeted by the event (e.g., a shape, a shape corner, a group etc.), its key (a unique identifier that will be matched by a node in our app-internal scene graph), and the coordinates of the event (translated from screen coordinates to the app-internal coordinate system by the coordinates() method).
To make all of this work, the periphery does not need to know much about the app core. In fact, it merely has access to the core via a single function execute (which takes a single argument, the command) that is injected in each device during initial app setup:
1
device.bindEvents(core.execute.bind(core))
As a result of the above call to bindEvents, the peripheral will know to call the execute method as an event occurs.
Next, we turn to Observer. Recall that our second task listed above was to keep the periphery “up to speed” with state changes inside the app’s core. The Observer pattern helps to provide an interface for that, since its express purpose is to allow “an object, called the subject, to maintain a list of its dependents, called observers, and to notify them automatically of any state changes, usually by calling one of their methods”, with the goal of defining “a one-to-many dependency between objects without making the objects tightly coupled”.
We implement this pattern by registering all peripheral devices with the core during initial setup. In practical terms, this means that, for each peripheral, we store a function react with the core, a function that is explicitly bound to the device:
1
core.attach(device.name, device.react.bind(device))
As a result, the core is (in Cockburn’s words) “blissfully ignorant” of the nature of the peripherals attached to it. All it does is maintain a list of functions, and it knows that it should call these functions as soon as there is a state change.
Main loop
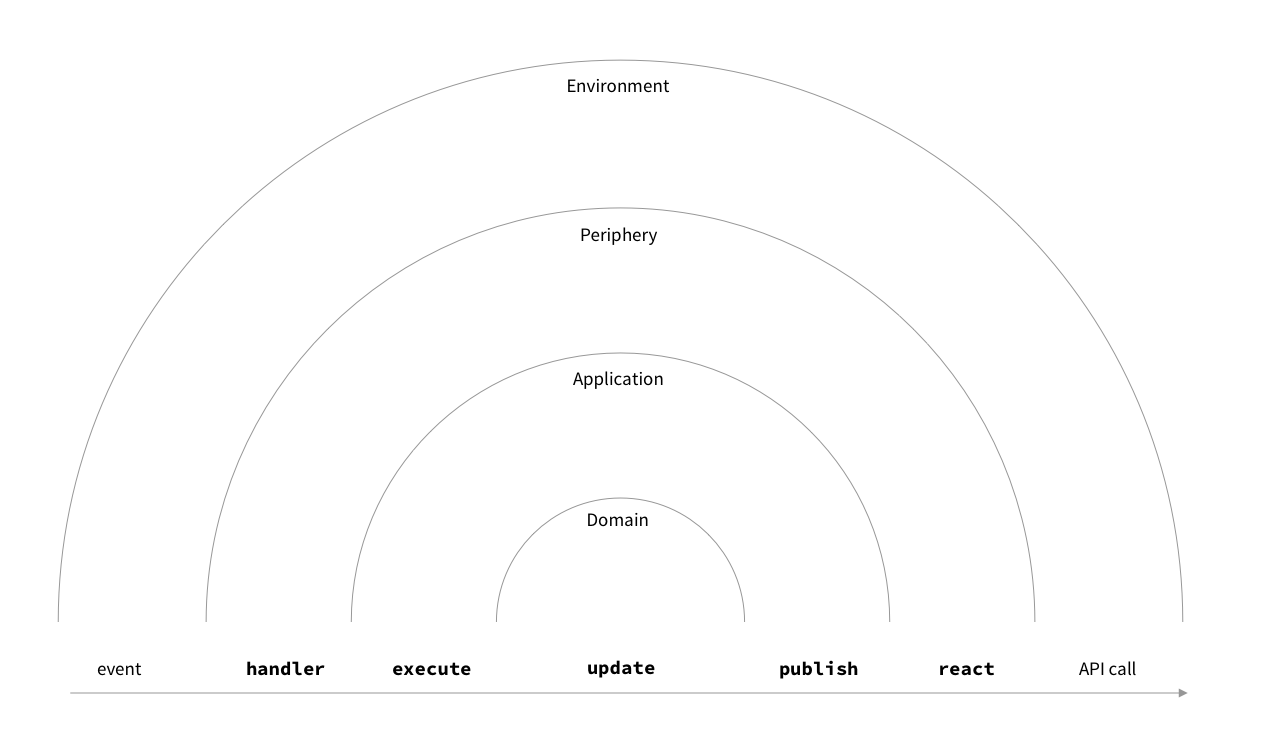
With a broad understanding of the onion layers and their interfaces in place, let’s take a closer look at the way data flows through the Pen application. Here is a description of one cycle of the Pen app loop:
- An event occurs in the environment and is dispatched to our app. This results in a previously registered callback being invoked. The callback processes the event into a command that is passed into the application layer.
- If the command is executable in the current state, the application finds a state transition corresponding to the command using the transition table. The machine transitions to that new state, and another callback (which we call an “update”) is triggered that mutates the scene graph.
- Once the update has run, the peripherals are notified of a recent state change. The peripheral devices inspect the notification and decide if the state change merits their attention. If this is the case from the perspective of a particular peripheral, it requests a snapshot of (part of) the current document, and ensures that appropriate changes are made to the environment, effectively syncing up the DOM (or the database backend) with the document state.
 A single event loop cycle, from event to API call.
As shown in the diagram, the above description closely corresponds to a series of nested function calls:
- periphery layer:
handler(event) - application layer:
execute(command) - domain layer:
update(state, command) - application layer:
publish() - periphery layer:
react(notification)
Here, handler is an event handler that was registered to be triggered by the event, and update is a callback triggered by a state transition of our finite state machine. Notice how the current task originates in the environment, and moves inwards, traversing application layers all the way through the domain, and moves back outwards, to the periphery, which triggers appropriate changes in the environment. Keep this description in mind, as we move on to discuss performance characteristics of Pen.
Performance
The first iterations of the Pen app were too slow. This section discusses some of the steps I took to optimize the application.
Bottlenecks
To get a grip on potential bottlenecks, it’s useful to first distinguish between discrete and continuous user actions. An example of a discrete action that occurs in virtually any application is the mouse click: the user clicks a button, or a particular region within the interface. Such actions tend to be “singular” in that it is rare to find users clicking repeatedly within a short time frame, unless they fear an interface has become unresponsive, or play a game. Examples of continuous actions include animations, scrolling, and dragging. These actions are characterized by a rapid succession of “similar” events.
The distinction is conceptual rather than technical, because from the perspective of the browser, both types of actions will manifest in the same way: as events. The distinction is technically meaningful, however, because the performance we need to deal with discrete vs continuous events is quite different. Research suggests that users tend to perceive responses to discrete actions as “immediate” if they occur within 100 milliseconds. For continuous actions, on the other hand, the recommendation is typically to produce a new frame that the browser can display within around 10 milliseconds, leaving the browser 6-7 milliseconds for layout and paint tasks. This corresponds to a frame budget of 16 milliseconds, and ensures a frame rate of 60 fps (1 second divided by 60 is around 0.0166 seconds, i.e., close to 17 milliseconds). Google has codified these recommendations in their RAIL model.
All of this is to say: for continuous actions, we need to be faster, quite a bit faster, in fact. It is no surprise, then, that continuous actions turned out to be the bottleneck in the Pen application. There are quite a lot of these actions in a drawing application. We have seen examples above: drawing, scaling, and focusing. When the user hovers over a shape, the shape needs to “light up” (focus) quickly. Similarly, drawing a Bezier segment of a path, or scaling a shape should feel “instant”. If the frame rate drops, this is immediately perceived by the user. And that is exactly the problem I encountered with early versions of Pen.
So this is the bottleneck. Let’s look at a performance diagram to narrow it down further. The following diagram (a screenshot from Chrome DevTools) shows a single app cycle (triggered by a mousemove event):
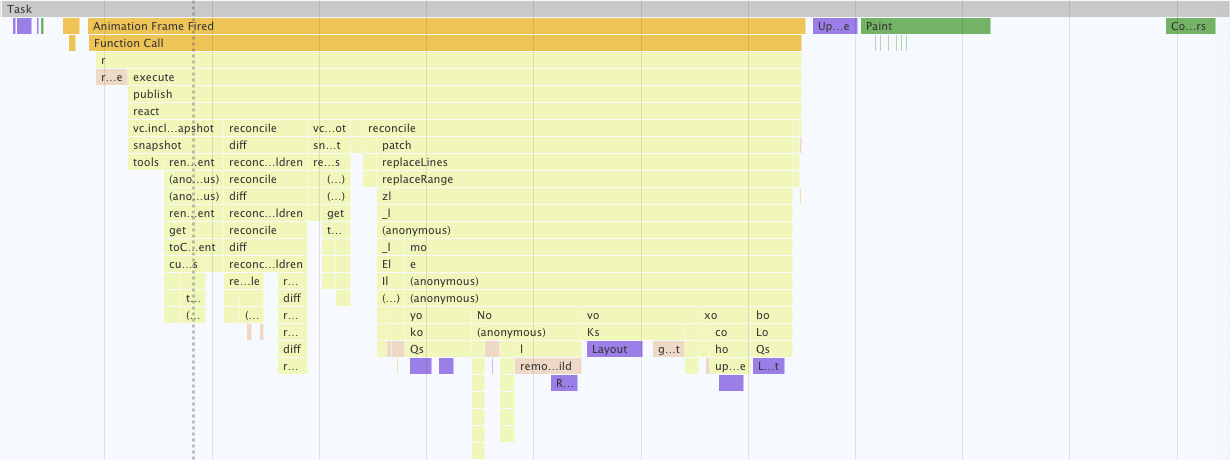 One app cycle in the Google Chrome performance tool.
The first observation here is that our app does quite a bit of scripting. Let’s zoom in on that scripting part:
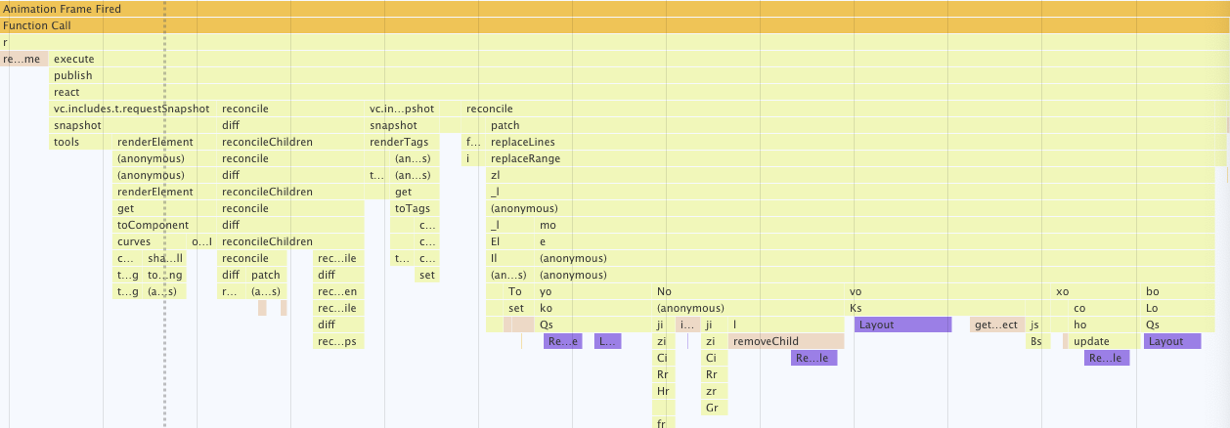 Part of cycle spent running our script.
The details do not matter as much here as the general picture: almost all of the cycle is spent in the publish() function (including nested calls). This is the part of the app cycle which passes information about state changes to peripherals, and has the peripherals update the DOM to sync to the internal state. So this is what we need to work on.
Zooming in further, the DOM is brought “up to speed” with the internal app state in two steps, shown below:
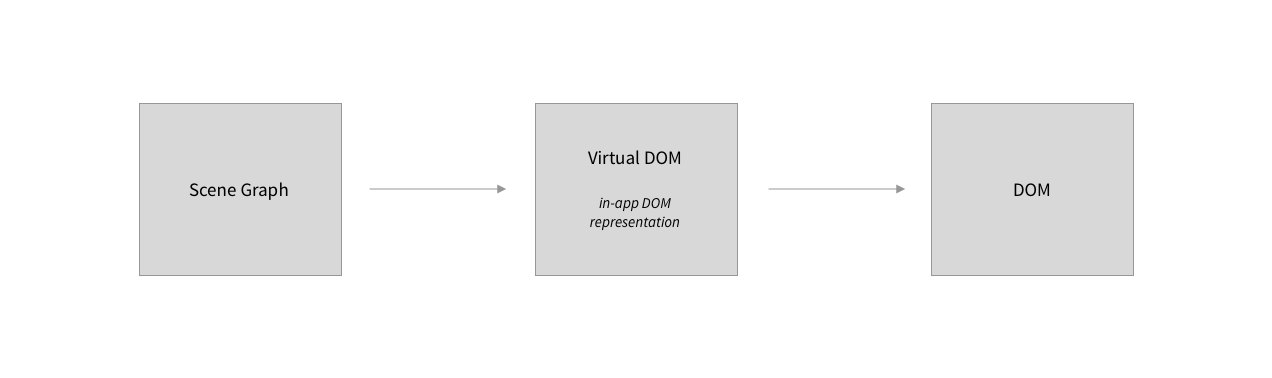 From scene graph to DOM tree.
Recall the the internal state is represented by a tree structure: the scene graph. The DOM is a second tree of a different type, and with a somewhat different structure. While the tree structure is attuned to the requirements of our business logic, the DOM tree is the manifestation of the internal state that the user interacts with, complete with all the bells and whistles required by the user interface.
What, then, is the “virtual DOM”, that sits in-between the two in the diagram above? Recall that the DOM is maintained by the app environment, and manipulated by app peripherals through APIs. In this sense, the DOM is “outside” our app. The virtual DOM, on the other hand, is an in-app representation of the DOM.
There are thus two conversion steps that happen before an app cycle is completed: we need to produce a virtual DOM that matches the scene graph. And we need to produce a DOM that matches its virtual counterpart. My initial approach to implementing these two steps was to produce a fresh virtual DOM from scratch after every state change, and subsequently update the DOM using a simple reconciliation algorithm (similar to the one discussed here). With the benfit of hindsight, this is quite close to being the least efficient way to go about the task, which would be to build both trees from scratch every step of the way, the virtual DOM as well as the real DOM. I did miss the forest for the trees for a while, however, until the overall sluggishness of my app made it abundantly clear that it struggled under the workload I was throwing at it.
Optimization
I implemented a number of optimizations to improve the situation, including synching the app loop with the browser’s rendering cycle via requestAnimationFrame() and splitting up composite SVG paths into smaller segments to reduce the time the browser has to spent painting. While both of these measures helped, the most noticeable improvement came from a technique called structural sharing. Let’s first discuss what that means in a simplified setting. Consider a linked list of integers, and assume that every node has a globally unique key. Here is a list with three nodes in JSON format:
1
2
3
4
5
6
7
8
9
10
11
12
{ 'key': 1,
  'data': 10,
  'next': {
    'key': 2,
    'data': 11,
    'next': {
      'key': 3,
      'data': 12,
      'next': {}
    }
  }
}
Now suppose we wanted to swap the node with a key of 2 with a node who carries the integer 9. We could use the following object to obtain our new linked list:
1
2
3
4
5
6
7
8
9
10
11
12
{ 'key': 5,
  'data': 10,
  'next': {
    'key': 4,
    'data': 9,
    'next': {
      'key': 3,
      'data': 12,
      'next': {}
    }
  }
}
Note that we are reusing the last node from the original list. Notice also that the old list is still intact. Anyone using the old list would not notice any changes. This is structural sharing in a nutshell. We have two objects that happily coexist while sharing part of their structure. In a picture:
 Structural sharing between two linked lists.
Structural sharing has many applications in functional programming. It’s used in git, for instance, but also by libraries such as Immutable.js that aim to make JavaScript data structures behave in a “more functional way.”
Let’s now use this idea for the task at hand. Going from scene graph to virtual DOM, we proceed like this: to every scene graph node, we attach a “virtual DOM cache”, i.e., a virtual DOM component that represents the node as it will look like in the user interface. If a setter method is called on one of the properties of a scene graph node, the cache for that node is cleared, as well as the cache of the ancestors of that node. Next, we assemble the new virtual DOM. It will look much like the old virtual DOM, except for the nodes whose cache has been cleared. Using a process very similar to how we derived the changed linked list from the original one above, we can build a new tree that shares part of its structure with the old tree, while keeping the old tree intact. So when making a change to a single node in the scene graph, only a few nodes in the virtual DOM need to be recreated. This makes producing the virtual DOM quite a bit faster compared to computing it completely from scratch.
This use of structural sharing has additional benefits when going from virtual to “real” DOM. This step is usually called DOM reconciliation. It works by recursively comparing two virtual DOM trees, and computing a number of patches that we can apply to the real DOM to have it reflect the internal state of the app.
Absent structural sharing, DOM reconciliation can feel a bit tedious, since we need to exhaustively compare node properties and children lists to be sure we have not missed any differences. Thanks to structural sharing, however, there is a shortcut. Since the old and the new virtual DOM trees share most of the nodes, we can effectively skip those during DOM reconciliation. This is because shared nodes do not need to be diffed by comparing their properties or children – they are the same!
While I implemented a number of additional tweaks to make the initial iteration of Pen run faster, the one just described was the most consequential, as it drives down computation times both for producing the virtual DOM, and for DOM reconciliation significantly compared to the unoptimized version that did not make use of structural sharing, and computed the virtual DOM from scratch on every state change. The unoptimized version exceeded the frame budget for continuous drawing actions by a factor of two to three even for very simple documents with few shapes. On the same machine, the optimized app runs well within that budget, even for quite complex documents.
Appendix: Design Patterns
For easier reference, this appendix gives an overview of the Gang of Four design patterns as they relate to key aspects of Pen, with links to the corresponding section in this case study.
Adapter
Alistair Cockburn, the inventor of hexagonal architecture, saw his model as “a particular use of the Adapter pattern”. In Pen, the code that transforms the scene graph into a virtual DOM tree useable by the user interface layer is an example of an adapter. The hexagonal model is discussed here.
Composite
Scene graphs, which we use to internally represent documents composed from vector shapes, are instances of the Composite pattern. We discuss scene graphs here.
State
Within Pen, finite state machines make state explicit, and make the application react differently to inputs, depending on the current machine state. This is a use of the State pattern. Finite state machines are discussed here.
Command
The inputs to the finite-state machine used by Pen are commands derived at the periphery, and interpreted by the application core. This is an example of the Command pattern, discussed here.
Observer
In Pen, peripheral devices that are attached to the application core receive notifications of changes as they occur, and react accordingly. This setup follows the Observer pattern, discussed here.